State Space Models

All state space models are written and estimated in the R programming language. The models are available here with instructions and R procedures for manipulating the models here here.

Sunday, March 23, 2025

Wolf Hall II and the Modern World System (1450-1640): Consulting Astrologer John Dee


I hope you are watching the final episodes of Wolf Hall Season 2 on PBS starting last Sunday, March 23, 2025 (the link is here and you might find parallels to the current political situation in the United States). In a prior post (here) I discussed Season 1. In this post, I will start laying some groundwork for Season 2. In future posts, I'll comment on the remaining episodes (you can stream Season2, Episode 3, Defiance or watch it over the air tonight).

Thomas Cromwell, the central character in the Wolf Hall TV series, lived from 1485-1540 during a period called the Long Sixteenth Century (L16, more information will be posted here). Cromwell was Henry VIII's chief minister and played a prominent role of the beginning of the English Reformation.

To help me understand the The Tudor Period (1485-1603), I've constructed a number of state space models for England, France, Spain, Italy, Germany, Portugal, the World System and other countries in the World-System using available historical statistics (see the country models here that will be attached to future posts)The most noteworthy aspect of my WL16 state space World System model (here) are the two Growth Error Correcting Controllers (ECCs), one is an environmental controller (Q-T) and another is a Malthusian Population and Production controller (Q-N)--see the Measurement Matrix in the Notes below. I can also compare the WL16 model to a conventional economic growth model driven by technological change.*


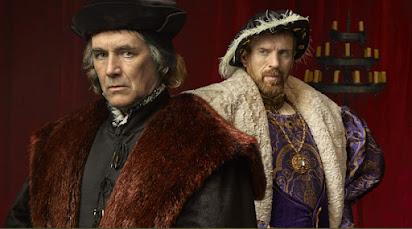
In the  Wolf Hall TV series, we are seeing the Tudor elites (Thomas Cromwell and Henry VIII) in all their splendor. All the heavy, elegant clothing had a purpose: the castles were cold and drafty and this was the Little Ice Age in Europe (graphic above from Waldinger, 2022). We find out little about the lower classes in the TV series, but we can be sure they suffered.

Another important aspect of the Long Sixteenth Century was that it was the start of Capitalist Agriculture and the formation of the World-System (discussed here and here). The evolution of the World-System is my primary interest in the Wolf Hall TV series because it helps bring the history to life.

Historical re-interpretation is another way to bring history to life and Hillary Mantel does this in Wolf Hall (see the Real Story Behind Wolff Hall and the Fall of Cromwell from the Smithsonian Magazine).
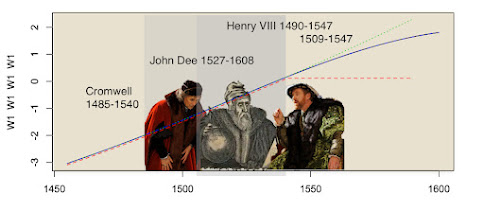

I'm going to extend Hillary Mantel by including John Dee (a character not in "Wolf Hall"). ChatGPT (here) reports that Henry VIII "...did rely on astrologers like John Dee (who later advised Elizabeth I) and may have had private interactions with individuals claiming to predict the future." In the graphic above, I assume that sometime before Cromwell's execution, John Dee made two predictions, one (optimistic forecast) for Henry VIII and one (less optimistic) for Thomas Cromwell. The optimistic forecast was "unlimited growth forever" (the dotted green line in the graphic above) and the less optimistic forecast (the black-blue line) for a Limit to Growth (the dashed red line was the Random Walk--history is just one damed thing after another).

I'm going to imagine that Henry VIII's response to the optimistic forecast was "Surely, Doctor Dee, I should care not for such World Systems when my appetites are solely for England."** Cromwell was not so dismissive in his response but encouraged Master Dee to focus on the best Geopolitical Alliance Henry might find through marriage. 


Dr. Dee went back to his extensive library in Mortlake, Surrey in England, dusted off his protractor and constructed geometric forecasts for Henry VIII and later Elizabeth I (Henry's daughter). In these forecasts, Dee was careful not to be seen as an unwitting tool of evil spirits. In future posts I will report on modern day versions of Dr. Dee's imaginary forecasts and concentrate on finding the best Geopolitical Alliances for Tudor England.


Notes

* The Environmental and Malthusian controllers are not the only ECCs that can exist is a socio-technical system, but they were the most important in the Long Sixteenth Century. Dynamic Component Models (DCMs) divide system variables into growth and cyclical component state variables. The growth component is equivalent to an economic growth model. The feedback components describe ECCs. Neoclassical Economic Growth theory has no concept of feedback and Climate Change models have struggled to identify feedback loops in Human Systems,

** Unfortunately, for Henry VIII's appetites and intuitions, the World System (specifically the WL16 model) was an important driver of England's development during the Long Sixteenth Century.

Data were taken from the Maddison Database and the Measurement Matrix (below was constructed from the available data using Principal Components Analysis, PCA). Q =  Aggregate Production, N= Population and T = Global Temperature. During the Long Sixteenth Century there was no concept of Aggregate Production, Aggregate Population, Global Temperature or the World System.


More detail about the model will be made available in future posts. You can run both and unstable and stabilized version of the WL16 model here. For more technical information, see the Boiler Plate.


Links

Wednesday, March 19, 2025

Boiler Plate


State Space Model Estimation

The Measurement Matrix for the state space models was constructed using Principal Components Analysis with standardized data from the World Development Indicators. The statistical analysis was conducted in an extension of the dse package. The package is currently supported by an online portal (here) and can be downloaded, with the R-programming language, for any personal computer hereCode for the state space Dynamic Component models (DCMs) is available on my Google drive (here) and referenced in each post.


Atlanta Fed Economy Now

My approach to forecasting is similar to the EconomyNow model used by the Atlanta Federal Reserve. Since the new Republican Administration is signaling that they would like to eliminate the Federal Reserve, the app might well not be available in the future.


While the app is still available, there have been some interesting developments. In earlier forecasts, the Atlanta Fed was showing GDP growth predictions outside the Blue Chip Consensus. Right now, after unorthodox economic policies from the Trump II Administration, the EconomyNow model is predicting a drastic drop in GDP (the Financial Forecast Center is only predicting a slight drop here).

Climate Change

Another comparison for what I have presented above are the IPCC Emission Scenarios. These scenarios are for the World System. Needless to say, (1) the new Right-Wing Republican administration plans on withdrawing the US from all attempts to study or ameliorate Climate Change and (2) the IPCC does not produce any RW modes for the World System (but seem my forecasts here).


World System

The longest running set of data we have for the World-System is the Maddison Project based on the work of Angus Maddison (more information is available here). Data on production (Q) and population (N) for most countries and regions runs from years 0-2000. More data becomes available as we near the year 2000. 


Available data were entered in a spreadsheet (see Population above, double click to enlarge). Missing data were interpolated with nonlinear spline smoothing using the R programming Language.


In cases where initial values were not available (see GDP above), the E-M Algorithm was used to estimate initial conditions.

From the graph of GDP above (W_Q) for the World System, it can be seen that economic growth from the year 0-1500 was basically flat. The period of British Capitalism (after 1500) had a small plateau of growth. Takeoff does not happen until the Nineteenth Century.


From a system's perspective, the only model that can be tested for the entire period is Kenneth Boulding's Malthusian Systems Model [Q,N] = f[Q,N].


When developed as a State Space model (measurement matrix above) there are two components: W1=Growth and W2=(Q-N), the Malthusian Controller. When more data is available, the Malthusian Controller can be generalized to other SocioEconomic theories.

What the Malthusian Controller shows (plotted as Q-N above) is that a long-developing Malthusian Crisis (Q<N) started in the Late Middle Ages and accelerated through the period of British Capitalism (Dark Satanic Mills) and was reversed spectacularly during the Nineteenth Century.  Takeoff in response to a deepening Malthusian Crisis would not be an unreasonable way to view Modern Economic Growth.

Error Correcting Controllers (ECC)


In another post (here), I presented Leibenstein's Malthusian Error Correcting Controller (ECC). It can be generalized to the dominant ECCs in most theoretical economic models (above). These controllers can be further generalized. For example, (X-U) and (L-U) can be generalized to (N-U), a more general Urbanization Controller which describes market expansion for economic growth. In countries and periods with limited data, (N-U) might subsume all these processes. ECCs describe important feedback processes in SocioTechnical System that are typically not recognized as such in academic literature.

Kaya Identity


The basic theoretical model underlying all the World-System models I crate is the Kaya Identity. There are a number of advantages to starting theoretical development with the Kaya Identity: (1) An "identity" is true by definition Adding other variables to the model ensure that theory construction is on a solid footing. (2) The Kaya Identity is also used as the foundation for the IPCC Emissions Scenarios allowing a linkage between World-Systems Theory and the work of the IPCC.


World Development Indicators (WDI)


After WWII, extensive data sets on all countries in the World-System became available from the World Bank (here). The indicators above where chose to construct the state space for each WDI-based model. Addition indicators can be added for specific forecasts and analyses.

Saturday, March 15, 2025

World-System (1950-2010) Trump Takes US on a Random Walk


In a prior post (here), I presented alternative futures for the US Economy. In terms of growth (the USL20 US1 state variable), the best models are the Business-As-Usual (BAU) model or the basic US state space model itself, both without input from the World System or other countries. From a statistician's perspective, this is the Make America Great Again (MAGA) model. Alternatively, the Random Walk (RW) model (history is just one damned thing after another) actually seems to be the best description of the Trump II administration's current (early) performance in office. Finally, from the Akaike Information Criterion (AIC, see the Notes below), the best description of US Growth from (1950-2010) is the RW model.

Does all this make your head hurt? First, no one can know the future. This is why the IPCC presents Alternative Emission Scenarios (here) rather than forecasts for CO2 emissions. The unpredictability of the future is why the Trump II administration (to be charitable) is behaving randomly (here) even though their preferred future is the BAU model with the US dominating the World-System.

The RW is a well-known but little acknowledge business strategy and Trump is trying to run the US government as if it was a business. The business theory is that if you are too predictable in your behavior, your competitors can easily predict your behavior and set up against you. The Left Wing cannot predict what Trump will do next so it is impossible to develop a strategy against him. The approach is similar to the Gish Gallop debating style which is also used by Trump and is difficult to rebut.

How reasonable is the RW model as a description of US growth? In the graphic above, I ran eight simulations of the US1 RW model, starting in 1950. Two of the models produced an upward growth trend, one of the models produced collapse. The other models produced weak performance with a slight negative trend. So, there is about an 88% chance that random management of the US Economy will not produce a crisis and might even produce an upward trend. Those are pretty good odds for a businessmen willing to take large risks and who has no idea how to run a government.

As a comparison, I've done a similar analysis for Mexico (here) where the RW is also the best short-term model and for Canada (here and here) where the BAU model is best. Argentina also is a favorite of the Trump II Administration for it's slash-and-burn policy approach (here); the RW model is also a good competitor (AIC = 76.58) for Argentina (you can run the ARL20 BAU model here) or read the verbal discussion (here).


Notes

 Akaike Information Criterion (AIC) for alternative models shows that the RW model is a strong competitor for US Growth, at least in the short-term.


You can run the USL20 BAU model here. It is also a strong competitor and produces uncontrolled exponential growth, a future growth path favored by many commentators.
 

State Space Model Estimation

The Measurement Matrix for the state space models was constructed using Principal Components Analysis with standardized data from the World Development Indicators. The statistical analysis was conducted in an extension of the dse package. The package is currently supported by an online portal (here) and can be downloaded, with the R-programming language, for any personal computer hereCode for the state space models is available on my Google drive (here) and referenced in each post.


Atlanta Fed Economy Now

My approach to forecasting is similar to the EconomyNow model used by the Atlanta Federal Reserve. Since the new Republican Administration is signaling that they would like to eliminate the Federal Reserve, the app might well not be available in the future.


While the app is still available, there have been some interesting developments. In earlier forecasts, the Atlanta Fed was showing GDP growth predictions outside the Blue Chip Consensus. Right now, after unorthodox economic policies from the Trump II Administration, the EconomyNow model is predicting a drastic drop in GDP (the Financial Forecast Center is only predicting a slight drop here).

Climate Change

Another comparison for what I have presented above are the IPCC Emission Scenarios. These scenarios are for the World System. Needless to say, (1) the new Right-Wing Republican administration plans on withdrawing the US from all attempts to study or ameliorate Climate Change and (2) the IPCC does not produce any RW modes for the World System (but seem my forecasts here).


Tuesday, February 18, 2025

World-System (1960-2010) Mexico Takes a Random Walk


In an earlier post (here) I used the MXL20 model to forecast eight futures for Mexico in the 21st Century. The best model was the Business-As-Usual (BAU) Model, however, in the short-run (year-to-year) the Random Walk (RW) actually had the best Akaike Information Criterion (AIC).


The shocks to the state variable MX1 (the Growth Shocks) are presented above. Mostly, the shocks are positive, except for around the turn of the Century (after 2000)*. In the short-run, year-to-year, the Mexican Economy has been able to continuously adjust to positive growth shocks. 


Notes

* The Growth Shocks are the residuals from the MX1_RW model. You should notice that the residuals are not normally distributed as are the residuals in the simulated MX1_RW presented at the beginning of the post. This is why I compute Bootstrap rather than normal distribution statistics.

AIC Statistics


Wednesday, February 5, 2025

World System: Generalizing the Malthusian Controller


In an earlier post (here), I presented Leibenstein's Malthusian Error Correcting Controller (ECC). It can be generalized to the dominant ECCs in most theoretical economic models (above). 

In future posts, where appropriate, I will explain each controller in more detail. The point to make here is that socio-economic systems are free to emphasize whatever controller seems appropriate during a particular historical period. It is an empirical matter to determine which controllers, if any,  are operating in a particular period. It is not something that can be deduced from theoretical speculation although historical analysis can reveal what was of most concern to elites. But, the historical analysis would just suggest a hypothesis.