State Space Models

All state space models are written and estimated in the R programming language. The models are available here with instructions and R procedures for manipulating the models here here.

Monday, March 31, 2025

What is a System?


In the past, I was not one who cared much for definitions. Now, I realize that the lack of clear definitions, particularly in the Social Sciences, has led to unnecessary misunderstanding. For example, in grade school, students learn that the Earth is a complex system with a number of spheres and feedback loops (see the graphic above--humans are located in the Biosphere). Then, students get to college and (might) learn in a Sociology course that there is (or maybe there isn't) a Capitalist World System. Or, they might read that the IPCC (Intergovernmental Panel on Climate Change) is having trouble identifying feedback loops in Human Systems. Then they might go back to Sociology (or Economics) and find that feedback loops are never discussed and that even the concept of a system is not taken very seriously.


Or a student might go to ChatGPT (here) and be given the definition above (with more text in the Notes below). At first, I had a problem with "components" and "work together to achieve a specific goal or function." Does the Earth System have a goal? Does it have components such as gear shifts (cars) or central processing units (computers)? Then I realized that the "component" parts of the definition are imposed on physical systems (which may or may not have them) so that we humans can better understand what we are talking about.

In the Earth System, the Atmosphere, Cryosphere, Hydrosphere and Lithosphere work together to support the Biosphere (Human, plant, animal life and consciousness--see Gaia philosophy). In my experience, critics have a field day with Systems Theory when it gets too speculative (e.g., Parsonian Systems Theory) and when definitions remain murky (particularly operational definitions, that is, measurement).


Just to make the discussion somewhat more concrete, does the graphic above (the Kaya Identity used by the IPCC) describe a system (where N=Population, Q=Output, E=Energy, CO2=Carbon Emissions and T = Global Temperature)? The extensive variables (N, Q, E, CO2 and T) are causally connected. The Impact (I=PAT) is described by the intensive variables (q=Q/N, e=E/Q, c=CO2/E and t=T/CO2).

As a conceptual system, the Kaya Identity is clear about the components, the interconnections, the purpose (explain climate change), the boundary (anything other than the extensive variables is out of the system) and inputs-outputs (N -> T).  It is only missing "feedback" mechanisms which, evidently, are optional. As a physical system, we know that all sorts of extensive and intensive variables are missing. Let's look at two well-known conceptual systems, the Malthusian Model and the Capitalist model to fill in some gaps.


The Malthusian system model (and here) is widely and deliberately misunderstood for all sorts of political reasons but the model (above) is simple, straightforward and unavoidable when trying to understand population growth and control. Population grows when there is an excess of Births over Deaths (b-d). Production (Q) does not necessarily keep pace with population growth (there is no technological change in the model--I'll add that next) and the difference, ECC=(Q-N), is the Error Correcting Controller (if you want to see specific examples of appropriately weighted ECCs, see the WL16 model). When population growth exceeds economic growth, it is a signal for population to decrease (or production to increase, if that is possible). The model is particularly appropriate for Peripheral Countries and for time periods before the Industrial Revolution.


The Capitalist Model (above) assumes that a system driven by technology can support any level of population growth. There are two kinds of technological change: Endogenous (tech) and Exogenous (TECH). The ECC in this model involves employment (L) and the substitution (or addition) of embodied technology (Fixed Capital) for workers. The original version of the model (from David Ricardo and Karl Marx) assumed that profits were generated from a fixed, subsistence wage (W=wL) when compared to production, R=(Q-wL), thus the ECC = (Q-L). The model is particularly appropriate for Core Countries and for time periods after the Industrial Revolution.

In the Essays on Biography, Part II, John Maynard Keynes wrote about both Malthus and Ricardo and their lengthy correspondence. Keynes felt that the foundations of Economics could have been based on either Malthus or Ricardo, but that Ricardo won to the detriment of future thinking. There is really no reason to have to choose. Both authors had perceptive insights. However, from the standpoint of Systems Theory, it is easier to start with Malthus. The Malthusian ECC can easily be generalized (here, here and here).

It is also important to understand that I am developing conceptual systems. The linkage to real systems is tested using statistical analysis, specifically Dynamic Component Models (DCMs). The reason for DCMs is that Directed Graphs can (1) easily get very complicated, (2) are not Canonical and (3) are isomorphic with a single DCM. For example, the Malthusian model can be easily added to the Capitalist model and both are isomorphic (when statistically estimated) with a DCM. In other words, Directed Graphs help us clarify thinking but they do not related uniquely to some real system.

Also, the DCM model separates growth components (state variables) from feedback components (cyclical variables). The components (state variables) are statistically independent since they are constructed with Principal Components Analysis (PCA). So we can analyze economic growth and business cycles separately and independently and still conduct a systems analysis.

Returning to the problem of whether or not there is a Capitalist World System and, if so, when and where did it develop, my solution would be to test the Malthusian and Capitalist models separately during a specific historical period where data is available. A Capitalist World System model would have to have a Capitalist ECC. For example, the Long Sixteenth Century World System Model (WL16, here) has both an Environmental and a Malthusian ECC. Since the Industrial Revolution Take-off did not happen until the Nineteenth Century (here), the result for L16 makes sense. 

World-Systems Theory looks at a world of countries (systems) under hierarchical controlCore Countries controlling Peripheral Countries. My approach is to test the hierarchical structure using different input variables to a DCM for each country and region. I also include a World System model (for example, WL16) to link directly with the IPCC World models and with the Limits to Growth models.

One more topic to address is attributes of the system: (1) Observability (are all the system states observable), (2) Reachability (are all the states reachable), (3) Controllability (Is the system controllable), (4) Stability (is the system stable), (5) etc. All these attributes are measurable for DCM models (see the dse, Dynamic System Estimation program). These attributes are only available in a formal systems model with clearly defined (through PCA) state variables.


Notes

Readers might wonder why I have not included a Market Model in the basic models above: (1) Both the Malthusian and Capitalist models are conducted in real terms (quantities are divided by prices), (2) there are no markets for population except in a slave system and (3) markets do not actually control the entire socioeconomic system (I prove the issue here).

Here are "Key Characteristics" and "Types of Systems" reported by ChatGPT:


Sunday, March 23, 2025

Wolf Hall II and the Modern World System (1450-1640): Consulting Astrologer John Dee


I hope you are watching the final episodes of Wolf Hall Season 2 on PBS starting last Sunday, March 23, 2025 (the link is here and you might find parallels to the current political situation in the United States). In a prior post (here) I discussed Season 1. In this post, I will start laying some groundwork for Season 2. In future posts, I'll comment on the remaining episodes (you can stream Season2, Episode 3, Defiance or watch it over the air tonight).

Thomas Cromwell, the central character in the Wolf Hall TV series, lived from 1485-1540 during a period called the Long Sixteenth Century (L16, more information will be posted here). Cromwell was Henry VIII's chief minister and played a prominent role of the beginning of the English Reformation.

To help me understand the The Tudor Period (1485-1603), I've constructed a number of state space models for England, France, Spain, Italy, Germany, Portugal, the World System and other countries in the World-System using available historical statistics (see the country models here that will be attached to future posts)The most noteworthy aspect of my WL16 state space World System model (here) are the two Growth Error Correcting Controllers (ECCs), one is an environmental controller (Q-T) and another is a Malthusian Population and Production controller (Q-N)--see the Measurement Matrix in the Notes below. I can also compare the WL16 model to a conventional economic growth model driven by technological change.*


In the  Wolf Hall TV series, we are seeing the Tudor elites (Thomas Cromwell and Henry VIII) in all their splendor. All the heavy, elegant clothing had a purpose: the castles were cold and drafty and this was the Little Ice Age in Europe (graphic above from Waldinger, 2022). We find out little about the lower classes in the TV series, but we can be sure they suffered.

Another important aspect of the Long Sixteenth Century was that it was the start of Capitalist Agriculture and the formation of the World-System (discussed here and here). The evolution of the World-System is my primary interest in the Wolf Hall TV series because it helps bring the history to life.

Historical re-interpretation is another way to bring history to life and Hillary Mantel does this in Wolf Hall (see the Real Story Behind Wolff Hall and the Fall of Cromwell from the Smithsonian Magazine).


I'm going to extend Hillary Mantel by including John Dee (a character not in "Wolf Hall"). ChatGPT (here) reports that Henry VIII "
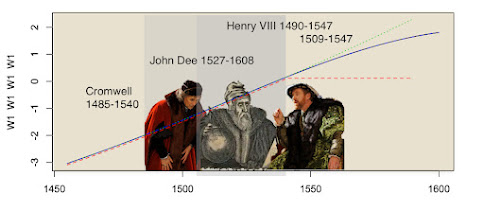
...did rely on astrologers like John Dee (who later advised Elizabeth I) and may have had private interactions with individuals claiming to predict the future." In the graphic above, I assume that sometime before Cromwell's execution, John Dee made two predictions, one (optimistic forecast) for Henry VIII and one (less optimistic) for Thomas Cromwell. The optimistic forecast was "unlimited growth forever" (the dotted green line in the graphic above) and the less optimistic forecast (the black-blue line) for a Limit to Growth (the dashed red line was the Random Walk--history is just one damed thing after another).

I'm going to imagine that Henry VIII's response to the optimistic forecast was "Surely, Doctor Dee, I should care not for such World Systems when my appetites are solely for England."** Cromwell was not so dismissive in his response but encouraged Master Dee to focus on the best Geopolitical Alliance Henry might find through marriage. 


Dr. Dee went back to his extensive library in Mortlake, Surrey in England, dusted off his protractor and constructed geometric forecasts for Henry VIII and later Elizabeth I (Henry's daughter). In these forecasts, Dee was careful not to be seen as an unwitting tool of evil spirits. In future posts I will report on modern day versions of Dr. Dee's imaginary forecasts and concentrate on finding the best Geopolitical Alliances for Tudor England.


Notes

* The Environmental and Malthusian controllers are not the only ECCs that can exist is a socio-technical system, but they were the most important in the Long Sixteenth Century. Dynamic Component Models (DCMs) divide system variables into growth and cyclical component state variables. The growth component is equivalent to an economic growth model. The feedback components describe ECCs. Neoclassical Economic Growth theory has no concept of feedback and Climate Change models have struggled to identify feedback loops in Human Systems,

** Unfortunately, for Henry VIII's appetites and intuitions, the World System (specifically the WL16 model) was an important driver of England's development during the Long Sixteenth Century.

Data were taken from the Maddison Database and the Measurement Matrix (below was constructed from the available data using Principal Components Analysis, PCA). Q =  Aggregate Production, N= Population and T = Global Temperature. During the Long Sixteenth Century there was no concept of Aggregate Production, Aggregate Population, Global Temperature or the World System.


More detail about the model will be made available in future posts. You can run both and unstable and stabilized version of the WL16 model here. For more technical information, see the Boiler Plate.


Links

Wednesday, March 19, 2025

Boiler Plate


State Space Model Estimation

The Measurement Matrix for the state space models was constructed using Principal Components Analysis with standardized data from the World Development Indicators. The statistical analysis was conducted in an extension of the dse package. The package is currently supported by an online portal (here) and can be downloaded, with the R-programming language, for any personal computer hereCode for the state space Dynamic Component models (DCMs) is available on my Google drive (here) and referenced in each post.


Atlanta Fed Economy Now

My approach to forecasting is similar to the EconomyNow model used by the Atlanta Federal Reserve. Since the new Republican Administration is signaling that they would like to eliminate the Federal Reserve, the app might well not be available in the future.


While the app is still available, there have been some interesting developments. In earlier forecasts, the Atlanta Fed was showing GDP growth predictions outside the Blue Chip Consensus. Right now, after unorthodox economic policies from the Trump II Administration, the EconomyNow model is predicting a drastic drop in GDP (the Financial Forecast Center is only predicting a slight drop here).

Climate Change

Another comparison for what I have presented above are the IPCC Emission Scenarios. These scenarios are for the World System. Needless to say, (1) the new Right-Wing Republican administration plans on withdrawing the US from all attempts to study or ameliorate Climate Change and (2) the IPCC does not produce any RW modes for the World System (but seem my forecasts here).


World System

The longest running set of data we have for the World-System is the Maddison Project based on the work of Angus Maddison (more information is available here). Data on production (Q) and population (N) for most countries and regions runs from years 0-2000. More data becomes available as we near the year 2000. 


Available data were entered in a spreadsheet (see Population above, double click to enlarge). Missing data were interpolated with nonlinear spline smoothing using the R programming Language.


In cases where initial values were not available (see GDP above), the E-M Algorithm was used to estimate initial conditions.

From the graph of GDP above (W_Q) for the World System, it can be seen that economic growth from the year 0-1500 was basically flat. The period of British Capitalism (after 1500) had a small plateau of growth. Takeoff does not happen until the Nineteenth Century.


From a system's perspective, the only model that can be tested for the entire period is Kenneth Boulding's Malthusian Systems Model [Q,N] = f[Q,N].


When developed as a State Space model (measurement matrix above) there are two components: W1=Growth and W2=(Q-N), the Malthusian Controller. When more data is available, the Malthusian Controller can be generalized to other SocioEconomic theories.

What the Malthusian Controller shows (plotted as Q-N above) is that a long-developing Malthusian Crisis (Q<N) started in the Late Middle Ages and accelerated through the period of British Capitalism (Dark Satanic Mills) and was reversed spectacularly during the Nineteenth Century.  Takeoff in response to a deepening Malthusian Crisis would not be an unreasonable way to view Modern Economic Growth.

Error Correcting Controllers (ECC)


In another post (here), I presented Leibenstein's Malthusian Error Correcting Controller (ECC). It can be generalized to the dominant ECCs in most theoretical economic models (above). These controllers can be further generalized. For example, (X-U) and (L-U) can be generalized to (N-U), a more general Urbanization Controller which describes market expansion for economic growth. In countries and periods with limited data, (N-U) might subsume all these processes. ECCs describe important feedback processes in SocioTechnical System that are typically not recognized as such in academic literature.

Kaya Identity


The basic theoretical model underlying all the World-System models I crate is the Kaya Identity. There are a number of advantages to starting theoretical development with the Kaya Identity: (1) An "identity" is true by definition Adding other variables to the model ensure that theory construction is on a solid footing. (2) The Kaya Identity is also used as the foundation for the IPCC Emissions Scenarios allowing a linkage between World-Systems Theory and the work of the IPCC.


World Development Indicators (WDI)


After WWII, extensive data sets on all countries in the World-System became available from the World Bank (here). The indicators above where chose to construct the state space for each WDI-based model. Addition indicators can be added for specific forecasts and analyses.